Tech Crafts Midterm Proposal: Simple Direction Sleeve

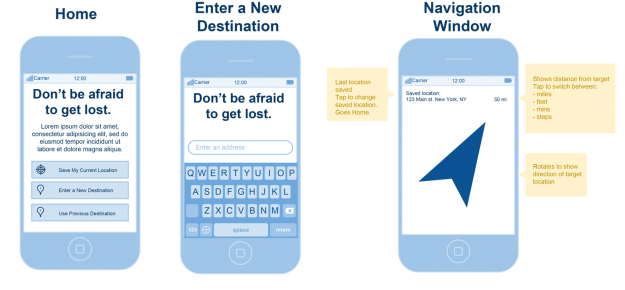
Last semester I designed a mobile app that is the stripped down version of a GSP navigation system. The idea is that sometimes those systems are overkill. My app only lets you know if you’re going in the right direction, leaving opportunities for finding your own way through discovery and even getting lost. I wanted to strip down a navigation system to a core idea: to let the user know what direction they should going to get to their target destination. In other words, it’s a customized compass that points in the direction you need.

My idea for tech crafts is to build on this concept of a simplified navigation system further and remove it from the screen completely. I want to create a fabric interface that does the same as the app. I was inspired to pursue this concept when I saw this video:
 
I propose to make a sleeve or a wristband to be worn while walking or biking. It will have lights in a circle to represent which direction to go and a switch which will be activated by either bending the wrist or squeezing the palm.

For the midterm, I will work on the switch turning the lights on.

Paper Light Dimmer

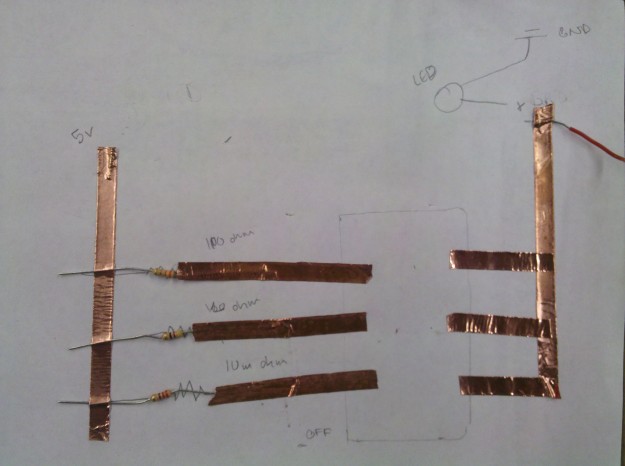
For our third assignment, we were to create a more complex mechanical switch. I choose to create a dimmer. The video isn’t very good, but essentially I have different resistors for each of the dimming levels. The “switch” itself has conductive tape behind it and closes the circuit at each dim level.

Paper Light Dimmer from Michelle Boisson on Vimeo.

Fantasy QS Systems: Nutrient Absorption Tracking and Cooking Tracking

The goal of this assignment is to show our conceptual and sketching process. We were todraw/sketch/code, in whatever way we  want (hand-drawn or digital or other method — use your imagination), two fantasy QS systems of instrumentation.

Nutrient Absorption Tracking

This fantasy QS system tracks food eaten and the nutrients consequently that are absorbed in the body.

Cook and Share

I can sometimes identify my sense of health when I cook and share that meal with someone (almost always with my partner, but it can be anyone). I really love the idea of feeding myself as opposed to buying ready-cooked food from someone else. And I love sharing what I made with someone else. I love to cook but I don’t do it as often as I’d like to or want to, especially while in school. So this fantasy QS systems identifies when I’m cooking and if I’m sharing the meal I made with someone. If this doesn’t happen for a while, I receive a text message with recipes I might be interested in and calendar availability so I can at least start thinking about when I can cook next.

Behavior Design Experiment: Help Your Body Stretch Your Brain

Olya and I collaborated on a little behavior design experiment to see if we can get our fellow classmates to do stretches at their desk while doing work on the computer.

Here’s are presentation on our process:

Twitter Data Analysis with R

Part 1


Part 2

Part 3

My family is from Haiti and I want to see what people are saying. I took streaming data about “haiti” for 1 hour and 15mins around 4pm on Thursday, Sept 27.
my questions:
where are they tweeting from?
how many tweets did i collect in over an hour?
what are these tweets about?
is there a difference about what people are tweeting based on location? What are people in Haiti saying?

Food as Art: Tator Tots and Kale

Over the weekend, for our sensitive buildings assignment, we were to read through How to be an Explorer of the World by Keri Smith, and pick one exercise to do. I choose to do Food as Art.

First-Order Feedback Loops: The Mood Ring and The Elevator

This weekend were to identify 2 systems, describe and diagram them. I’m interested in possibly doing a project around identifying moods and their triggers. There are a few apps and web services out there that help users keep a log of their feelings and moods. They require a user to input the data manually. I wanted to look at a simpler system, used before apps and the web: the mood ring. The mood ring, popularized in the 70s, does not tell you how you are feeling directly, but it does react to changes in your body temperature which are certainly affected by your mood. What does this system look like as a graph?

In this mood ring system, the goal is to get the data of the current mood. The thermotropic liquid crystals in the ring react to the body’s change in temperature; they are the sensors, the body, the environment.  The crystal’s chemistry (the comparator) takes the input of temperature and twist themselves which changes the color of the ring (the actuation). This system does not contain a feedback loop in itself. It would require the person wearing it to watch the ring change colors and then make a decision as to whether they wanted to change something about their mood (or body temperature).

I think it could be interesting to capture this data and combine it with other data like gps location, calendar schedules, or simply a personal log.

Another system I looked at was an elevator.

In an elevator, the goal is to get a person to the floor they desire, here it’s the 9th floor of the building. A light or magnetic sensor lets the computer know where the elevator is in the building. The computer, acting as the comparator, responds by driving the motor, the actuator. The motor can then affect the elevator’s place in the building. This is a first-order feedback loop.

I was curious about what an older elevator system, one without a computer but an elevator operator, looked like in a diagram.

The goal, the environment, the disturbances are the same, but the system is different. The operator’s eye are the sensors, his mind, the comparator, and his hand on the crank, the actuator. In doing research for this, I found this anecdote from an elevator operator. It made me think about the automation of processes from computers and how we lose the human element of things. The human operator is the interface between the people getting in and the elevator itself. The new interface is the button. My favorite part of his story is this one:

Most people do say their floor number when they get on the elevator. In appreciation I sometimes mention “It’s time all this ‘hi’ and ‘how are you’ stuff was replaced by numbers anyway. We are right on the cutting edge of etiquette here.” One person waved goodbye as he got off the elevator and said “Fourteen.”

People are funny.
Tech Craft Assignment 2: Paper Macbook On

I made a simple paper switch. Push the power botton and the MacBook glows.

The back of the button that closes the circuit

The Back

The front

Stop and Frisk Data, Part 2

HOMEWORK PART I


Question #1
Write code to return the percentage of people who were frisked for each race.  In other words, count up the number of people who were frisked for a given race divided by the number of people of that race stopped.  Which race leads to the highest percentage of frisks?  Which one the lowest?

The race leading to the highest percentage of frisks is Black Hispanic at 59.7%

The race leading to the lowest percentage of frisks is White at 41.9%.

Question #2
Plot the number of times each crime occurs in descending order (we’ve learned a couple of ways to do this, though using sort(), table() and that new type= parameter to plot() is your best bet).   What does this distribution of crimes look like?  In other words, are there an equal number of every kind of crime or are there a few that dominate?

No, they are not equally distributed. There are a few that make up most of the crimes suspected.

Question #3
Well I’m kind of answering that question for you here – let’s take the top 30 suspected crimes and look at those.  If we were to just look at stops where the crime.suspected was one of the top 30 crimes, what percentage of the stops would that cover?  Do you think that’s enough?

The top 30 crimes suspected cover 91.3% of all crimes suspected. I think that that would be enough.

Question #4
Write code to create a variable called “crime.abbv” that consists of just the first three letters of crime.suspected and show the code to add it to our main data frame.  Now what percentage of the stops do the top 30 crime.abbvs account for?

Now, using the abbreviated names for the crimes suspected, the top 30 make up 98.4% of all crimes.

HOMEWORK PART II

Observation Presentation, Zuccotti Park

Proudly powered by WordPress
Theme: Esquire by Matthew Buchanan.